Project Notebooks
My projects are organized into following notebooks.

Statistics - The intuitive way
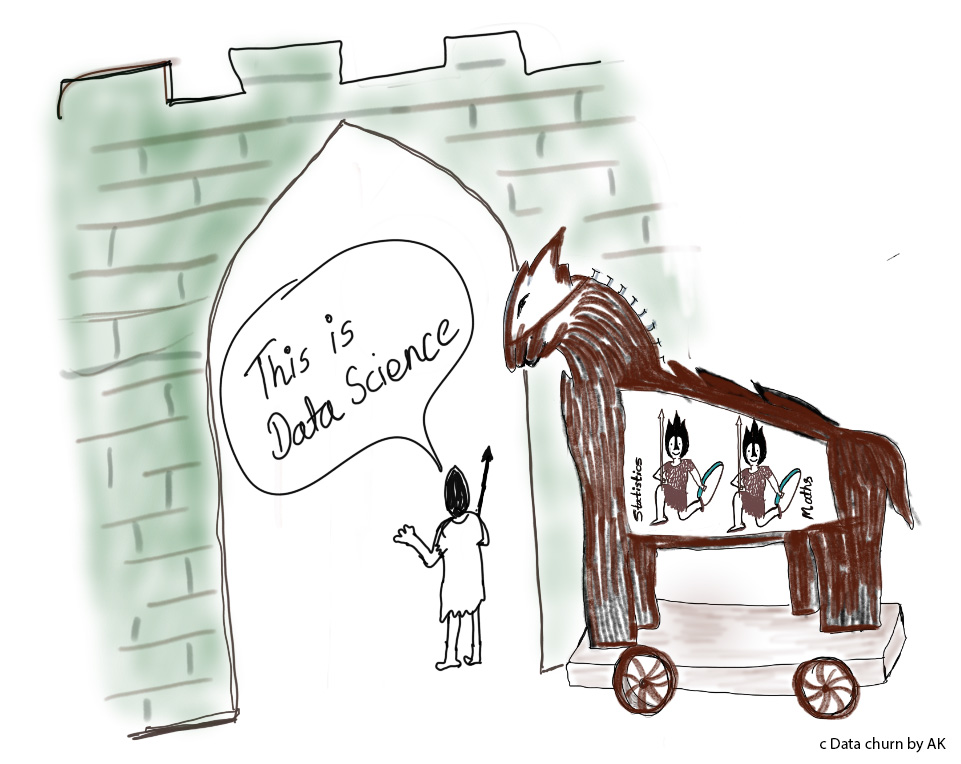
The impressive and complicated models frequently showcased as triumph of cutting edge advancement in AI and computer science on the heart relies on the principles and theorems developed in statistics and mathematics. Therefore one of my top priority projects is to have clear idea on concepts like sampling distribution, hypothesis testing, analysis of variance and experimental design.
Statistics
One of the struggles I had while learning statistic was to build intuitive thinking about fundamental concepts of statistics like inference, hypothesis testing, and probability distribution. This is where I adopted the, learn by experimenting method. It is really hard to build intuition just by seeing one or two datasets presented in a textbook. Being a student of science, I wanted to experiment every statement and theories discussed in a textbook. The best tool I found to do so is R, which is basically a metaverse for statistics. Every theories in statistics can be tested in R by generating some dummy data. It has support for any type of distribution and we can simulate any kind of sample. Doing so helped me skip theoretical proof of theorems in statistics, but still get clear picture of what the equation is doing. I can generate thousands of samples in R and see the distribution of sample means and variance which will be very close to the one given by the mathematical equation. This approach helped me a lot to learn both statistics and R. So, I want to share my notes with everyone who wants to learn statistics with minimum mathematics. All my notes on category of Statistics are my attempts to explain each topics with as much experiment as possible.
- Principle of inference
- Mean and Variance
- Permutation and combination
- Probability theory
- Statistical distribution
5.1 Binomial distribution
5.2 Normal Distribution (t-distribution, \(\chi^2\), F- distribution) - Hypothesis testing
- ANOVA (One-way and Factorial)
- Regression (Simple, multiple)
- Degree of freedom

GGplot2 for visualization
Data visualization can be done by using multiple tools like excel, ggplot, js or other. GGplot is one of the most flexible and powerful tool.
Read less
Background
Different people start learning to code at different time point in there career with different goals. I myself had started coding because …
Read less